What Students’ Clicks Can Teach Us About Closing Achievement Gaps – Digital Promise

What Students’ Clicks Can Teach Us About Closing Achievement Gaps

A teacher helps students during a coding lesson at Sutton Middle School.

December 10, 2025 | By and

Key Ideas

  • Strategy matters as much as knowledge. How students approach problems—their clicks, revisits, and tool choices—accounts for a meaningful portion of achievement gaps.
  • Teachers have new leverage. By explicitly teaching problem-solving routines and purposeful tool use, educators can help students work smarter, not just harder.
  • Systems need better data infrastructure. Districts and states should capture de-identified process data to inform instruction and equity, while maintaining strict privacy protections and avoiding high-stakes uses.

The Hidden Story Behind Every Answer

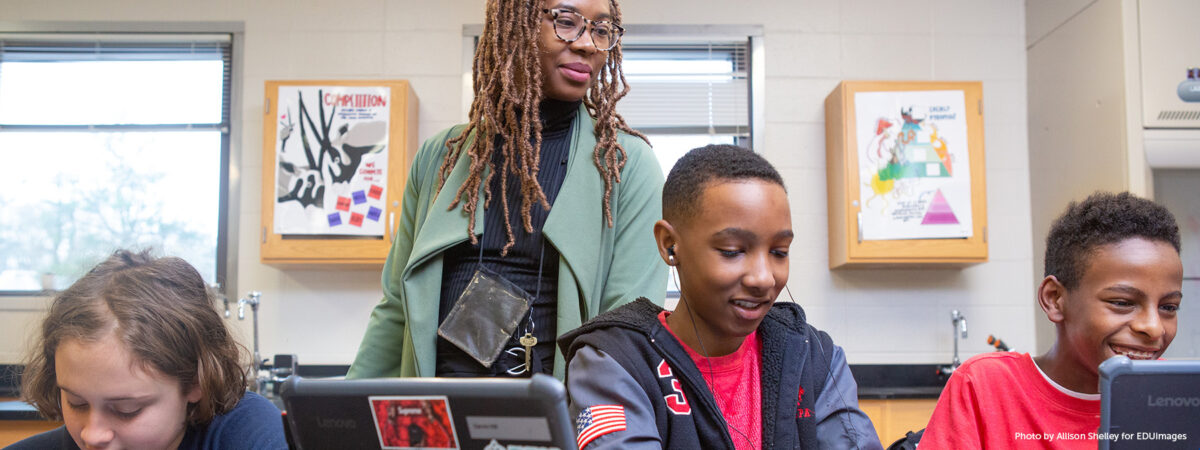
Picture two eighth graders taking the same math test. Both get question 12 wrong. But one student spent 45 seconds, never used the digital notepad (scratchwork) tool, and moved on. The other spent three minutes, used scratchwork extensively—writing and erasing multiple times—and returned to the question twice.

Traditional scoring treats these students identically—both missed the question. But their approaches tell vastly different stories about what they need to succeed.

This is the promise of process data: the digital record of every click, pause, and tool use students make during computer-based learning and assessments. New research suggests these digital breadcrumbs can help us understand persistent achievement gaps.

Three Test-Taking Behaviors Account for Achievement Gaps

In a study published in Psychometrika, researchers Sunbeom Kwon and Susu Zhang analyzed thousands of student records from the 2017 National Assessment of Educational Progress (NAEP) Grade 8 Math assessment. They found that differences in students’ test-taking behaviors accounted for a statistically significant portion of the achievement gap between students with learning disabilities and their peers. These differing behaviors include:

  • Strategic patterns: “Quick movers” who use minimal tools; “deep processors” who extensively use scratchwork; or “skip-and-return” strategists who defer difficult items.
  • Revealing error types: Students who simply misplaced decimals in multiplication (showing conceptual understanding but careless execution) versus those who used completely incorrect procedures—like separately multiplying numbers on each side of the decimal point.
  • Unproductive tool use: Students who explored irrelevant tools, such as using text-to-speech and highlighting problems with no text, which didn’t help them solve problems and often wasted time versus students who used these tools productively.

These findings matter because strategies and effective tool use can be taught and learned. When students learn to approach problems more efficiently—such as by choosing the right tools, catching careless errors, and managing their time strategically—they don’t just perform better on tests; they also develop transferable skills that support learning across subjects and contexts.

Below, we share practical recommendations for teachers, district leaders, and policymakers to incorporate strategy instruction and its data infrastructure in schools.

What Teachers Can Do

  • Make strategies visible. Many struggling students have never seen what strategic problem-solving looks like, so model your thinking process aloud: “I’m reading this twice. Now I’m highlighting key numbers. I’ll sketch a diagram in a digital notepad before calculating.”
  • Teach purposeful tool use. Co-create a simple guide with students showing when tools help (scratchwork for multi-step problems) versus when they don’t (simple recall questions). Accessibility features only work when students know how to use them strategically.
  • Build in brief reflections. After practice assessments, ask: “Which tool helped most today? Did you skip and return to any questions? How did that work?” These moments develop strategic self-awareness that transfers beyond tests.

What District Leaders Can Do

  • Request process dashboards from vendors. When selecting digital assessments, ask vendors for reports showing time per item, tool usage rates, and revisit patterns by subgroup. These insights cost vendors almost nothing to generate, but reveal how students engage, not just whether they’re correct.
  • Add strategy indicators to MTSS. Your Multi-Tiered System of Supports (MTSS), the framework for providing targeted interventions to struggling students, likely tracks skills gaps. Consider adding behavioral flags for students who rarely use tools despite struggling, excessive revisits, or rushing without verification. Early identification of unproductive patterns enables targeted coaching.
  • Create job-embedded professional learning. Rather than one-off workshops, build cycles where teachers test new routines, review anonymized process data, and share insights with colleagues. This turns research into sustainable practice.

What Policymakers Can Do

  • Modernize reporting requirements. Require assessment vendors to provide de-identified process metrics, such as time per item, tool usage, response changes, as standard reports. This gives educators actionable data beyond scale scores at minimal cost. These metrics must remain aggregate and non-punitive, informing instruction but never evaluating individual teachers or schools.
  • Fund innovation pilots. Offer grants for districts to test explicit “digital test-taking routines” or strategy coaching embedded in regular instruction. Require rigorous evaluation to build the evidence base.
  • Evaluate accommodation efficacy. Use process data to ask: Are special education students using their accommodations? Do English learners benefit equally from text-to-speech?

Why This Research Matters

Achievement gaps have persisted despite countless interventions targeting content knowledge alone. This research offers a complementary lens: gaps aren’t just about what students know, but are also about how students approach problems.

The encouraging news is that strategic behaviors are malleable. A student who rushes can learn to plan. A student who never uses scratchwork can be taught when it helps. A student who gives up quickly can develop persistence strategies.

Process data makes the invisible visible, which only requires learning from data that already exists but is currently discarded.

Prioritize transparency. Publish plain-language family guides explaining what process data is collected, how it’s stored, and how it improves learning. Commit explicitly that it will never be used for high-stakes decisions.

Where to Start

Teachers: After your next quiz, have students reflect for five minutes: “What was your strategy? What would you try differently?” Use their insights to guide discussion about effective approaches.

District leaders: Ask your assessment vendor: “What process data do we collect? Can we access it?” You may be surprised by what’s already available.

Policymakers: Review state assessment contracts. Identify where you could require process data reporting with strong privacy guardrails.

Every click tells a story about how a student thinks, plans, and problem-solves. For too long, we’ve focused only on right or wrong. By paying attention to the how alongside the what, we gain powerful tools to support every student’s learning journey.

Read the full study on Cambridge University Press.

Sign Up For Updates! Email
Loading...