“Did you see that?”
“That dot got bigger. Let’s drag it.”
Student engagement was palpable, and these exclamations could be heard in a sixth grade English language arts (ELA) classroom as students learned about character traits by exploring a network visualization. A network visualization is a series of nodes (circles) and edges (lines that connect the nodes). Nodes get larger based on the number and weight (importance) of connections with other nodes. Gone were the highlighters and blank stares usually present when exploring character traits. Instead, students were actively navigating a network visualization in which nodes represented characters and character traits from the novels Walk Two Moons and Roll of Thunder, Hear My Cry. The edges connected characters to the character traits students identified while reading (see example). And students were fascinated by what they were seeing.
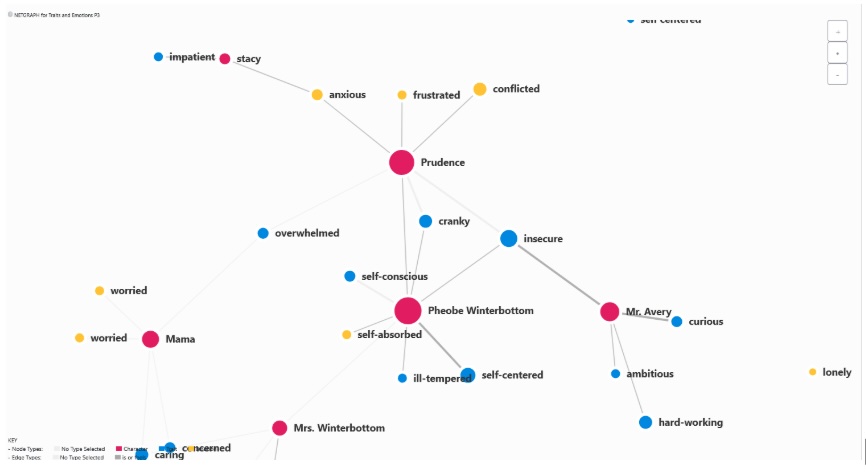
Example of a network visualization about characters and character traits in the novel Walk Two Moons.
“Are you saying that our characters are stubborn?”
Inference, textual evidence, and character traits are traditional topics for English language arts class, but network visualizations and data literacy are more traditionally associated with science and math. Yet, ELA teachers in Talladega County Schools have seen how network visualization and traditional ELA content overlap and align in new and enriching ways. To build this network visualization, students added edges between character names and character traits. As students contributed to the network, they could see the nodes of certain traits like “stubborn” get larger, demonstrating prominent common traits of characters in that novel.
This activity helped students see that text is also a form of data, and ELA interpretation is a form of data literacy. Ms. Norred, one of the teachers trying network visualizations in her class, shared, “I really like showing them that you also [infer] from data within a network. You could do it from a table, you know, in different ways to represent how much, how many different ways data is represented and how we read data.”
When adding edges between characters and character traits, students needed to provide evidence for their choices—another traditional ELA skill that can be difficult to teach. During this lesson, students were motivated to defend the edges they were adding. Ms. Ginn, another teacher trying out networks in sixth grade ELA shared, “They were bringing in textual evidence, saying, well, this character did that, and I’ve done that, and, or I like this—they were bringing all of that in.” These ELA teachers saw that using text as data helps to reinforce skills they were already teaching and that are foundational to ELA.
“Something’s wrong…The network looks funny.”
As students built their ELA skills, they also developed important data literacy skills that built on ELA skills during these lessons. Students learned why errors in data can lead to false conclusions. When the network was not showing the character trait “self-centered” as common for the characters in Walk Two Moons, students realized that something was wrong with their data. Character names had been entered more than once. As a result, the network visualization was off—nodes that should’ve been large were not because edges were created to different nodes with the same character name. Having this moment of reckoning helped students understand the importance of accurate data entry. Recognizing that network visualizations are only as good as the data that is entered is essential for helping students to be critical consumers of infographics and other network visualizations they consume regularly.
Students also learned methods for analyzing large data sets. Ms. Ginn shared how students struggled to digest all the information in the networks at first: “Sometimes when you’re putting in data, you know it can be overwhelming, especially if there’s a lot to look at.” To help with this, the teachers taught students how to use different tools in NetCreate, the digital network visualization tool developed by researchers at Indiana University for classroom use. When students were curious about character traits in the novel Walk Two Moons versus the novel Roll of Thunder, Hear my Cry, they learned how to filter data so that they only saw nodes and edges related to one of the novels they were reading. When presented with large data sets, learning how to filter or reduce data is important for analysis.
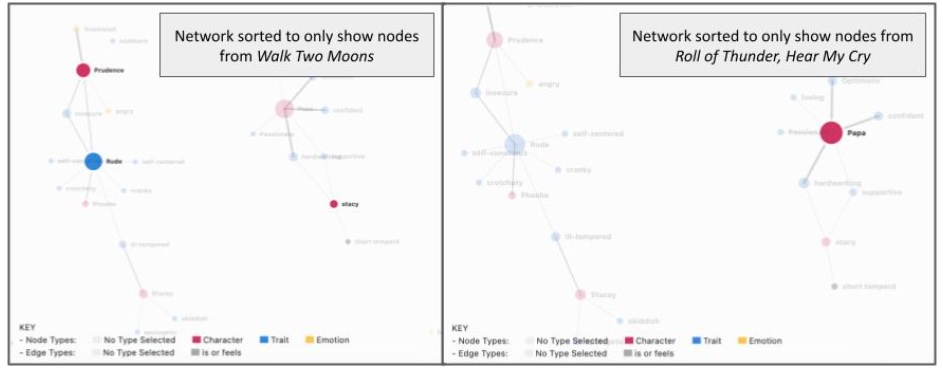
A comparison of two network visualizations each filtered to highlight the characters from each novel, Walk Two Moons and Roll of Thunder, Hear My Cry.
“What would we have done to make those connections without something like [NetCreate]?”
ELA teachers also valued how using network visualizations in ELA classes helped to make abstract concepts concrete for their students. Concepts like theme and allusions are often difficult for some students to understand. The teachers that worked with NetCreate felt like seeing these ideas as nodes and edges and being able to drag nodes around, filter out certain information, or create their own edges gave students a more tangible way to interact with these theoretical ideas.
Ms. Burns, another ELA teacher using NetCreate, shared, “Until some of those kids see it visually like, ‘Oh, this connects here or this connects here,’ some of them don’t get it. You know what I mean? They are not having that aha! moment until they can see it visually.”
Data, visualizations, and information are everywhere in students’ daily lives. Tools like NetCreate and network visualizations provide innovative opportunities for students to learn essential ELA skills that prepare them to be critical readers, writers, and interpreters in a data-centric world.
Digital Promise and Indiana University are looking for teachers interested in trying NetCreate lessons in their middle school humanities classes. The deadline to apply is May 15, 2025. More information here.
Not a middle school humanities teacher? While NetCreate is still under development for public use, data visualizations can be developed using free tools you may already have access to like Google Sheets, Microsoft Excel, Canva, Tableau, Tagxedo, Google Draw or Miro.
Want to know more about data visualizations? Find more resources here:
This material is based upon work supported by the National Science Foundation under Grant Numbers 2241705 & 2241706. Any opinions, findings, and conclusions or recommendations expressed in this material are those of the authors and do not necessarily reflect the views of the NSF.