
Students will create collect data from their surroundings to better understand every day phenomena
Tools/Materials Required: A device or notepad to record notes and data, other materials as needed
Depth of Knowledge: Strategic Thinking
Teacher’s notes are in purple. For the student’s version, see Phenomenal Data Student Guide.
How might we use data to learn about something we observe in our everyday surroundings?
Do you ever wonder why tree leaves change color in the fall? Or why some foods rot faster than others? Although the answers to many of these kinds of questions can be found on the internet, we can also collect data to help us better understand phenomena we observe in our everyday surroundings.
In this project, you will first come up with your own driving question about something you can observe in your everyday surroundings. Then, you will create a plan to collect data that will help you learn more about your driving question. Finally, you will go collect your data and reflect on what you’ve learned.
Step One: Create a driving question.
Come up with a driving question that you will use data to answer. For example, your driving question could be “Why do tree leaves change color in the fall?”
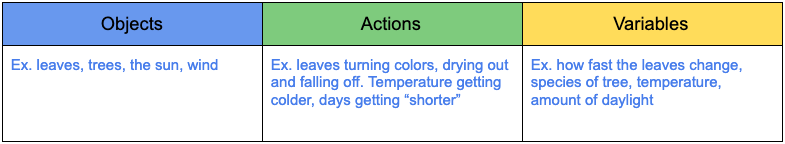
Step Two: Identify the objects, actions, and variables.
Create a table like the one below to identify the objects, actions, and variables related to your driving question.
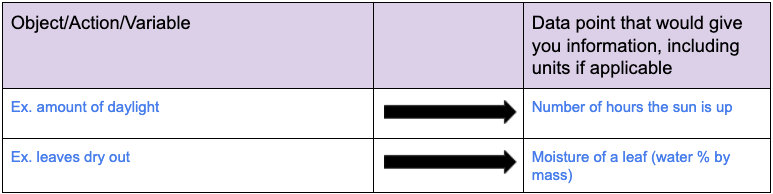
Step Three: Connect an object, action, or variable to a data point that can be used to evaluate it.
Create a table like the one below to connect the objects, actions, and variables to data points. Use the far-left column to identify what you want to get more information about. Use the far-right column to brainstorm what kind of data you would collect to give you that information
Tip: If you get to this step and realize your driving question cannot be answered by collecting data on an object, action or variable, consider how to change your driving question so that it is measurable.
Step 4: Choose the most important data points to collect.
Review the connections you made. Which are the most important data points to help you answer the driving question? Create a list.
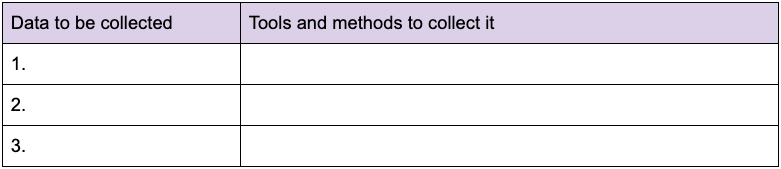
Step 5: Determine how you will collect the data.
For the data points you identified as important, brainstorm ways (the tools and methods) to collect it. It may be helpful to make a two column table as below:
Step 6: Go out and collect your data!
When you are ready to organize and present the data you collected, consider the different types of graphs you can use. These resources from Tuva Labs and NCES can help.
Step 7: Reflect on your work