Research Map
Visualization
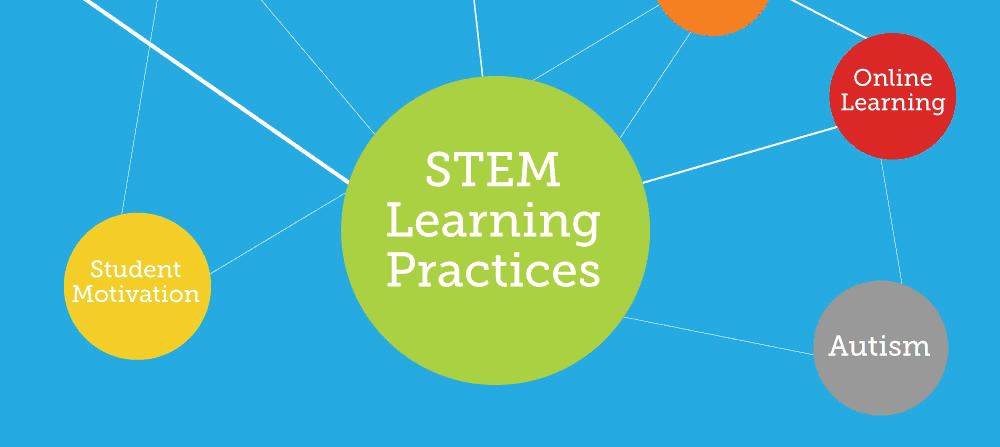
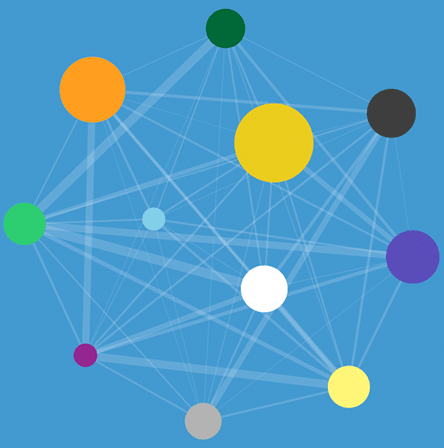
The Research Map visualization is a visual representation of the last 10 years of published education and learning sciences research.
INSTRUCTIONS
Explore research topics and find connections between topics. Access and save articles of interest.
-
 Circles represent research topics. The size of the circle is proportional to the number of publications on that topic.
-
 Lines represent connections between topics. Line thickness is proportional to the similarity of two topics.
-
 Double-clicking a topic drills into subtopics. To go back to the top level, click the “Reset” button.
Get Started
loading...