Through funding from the Walmart Foundation, Digital Promise sought to understand how data sharing could create a data-driven learning ecosystem for frontline workers that could promote access to personalized learning opportunities and skill building in order to support workers’ economic advancement. To answer this broad-reaching question, we identified three general categories of questions which drove our work:
Between May and October, 2018, the Digital Promise research team conducted 43 interviews and focus groups with 44 individuals across the multitude of sectors that interact with frontline workers, including government agents, education and training providers, technology vendors, workforce development boards, and employers. Interviewees were primarily identified by our advisory board, though, in some instances, interviewees referred us to others in the frontline worker ecosystem who could contribute to the project. Interviews were typically 60 minutes in length and most commonly conducted using Zoom Conference, though interviews for the Lake Tahoe Case Study were conducted in person.
After conducting an extensive literature review in April 2018, researchers developed three interview protocols tailored to the three major stakeholder categories: providers, employers, and those speaking from a systems level perspective, such as staff at state governments or foundations. Each protocol was custom tailored to the specificity of the interviewee; for example, while there was a standard protocol for those we spoke to from Human Resource departments, the company size, breadth of and history with employee training, and current efforts drove the questions emphasized in the interviews. We asked each person we interviewed to describe their current organization’s use of data, their perceived benefits and challenges to data sharing, and recommendations to improve the system to be data-driven and more personalized for individual frontline workers/learners.
Given the exploratory nature of the study, we conducted a thematic analysis of the qualitative data. While many qualitative analysis methodologies are tied to particular epistemological or theoretical perspectives, thematic analysis is a method that enables reliable, yet flexible interpretation of the data, thus allowing us to more openly learn from the insights of those interviewed (Braun & Clarke, 2006; Clarke & Braun, 2013; Maguire & Delahunt, 2017). As qualitative researchers Braun & Clarke (2006) explain, thematic analysis is intended to identify themes, or patterns, in the data that are important to address the research question, which requires analyzing beyond the themes of the research questions in order to effectively interpret and make sense of the data.
Our analysis followed Braun & Clarke’s (2006) six-phase framework, beginning with becoming familiar with the data in order to generate our initial codes. Each interview was coded by two researchers at Digital Promise for reliability. Interviews were transcribed through Rev.com. We analyzed interview transcripts using Dedoose, a cross-platform software package for analyzing qualitative data that allows researchers to code text, record memos, and analyze emergent themes.
After each interview or focus group transcript was coded by two researchers, codes were examined to search for themes (Braun & Clarke, 2006). Many of the initial codes lent themselves to convergent themes, such as perceived barriers to effective data use in the current ecosystem, perceived benefits to data use and sharing, and levers for change. Themes were largely descriptive of the patterns that emerged from the interviews; interestingly, we learned that the current ecosystem rarely, if ever, collects outcome data and the infrastructure typically blocks effective analysis of data, showing us that data interoperability is leaps ahead of where this conversation needs to begin. All codes and excerpts fit into one or more of the themes:
* applied when a code fits into multiple themes
Incorporated Codes
Incorporated Codes
Incorporated Codes
Incorporated Codes
Incorporated Codes
Incorporated Codes
Incorporated Codes
Incorporated Codes
Next, researchers reviewed the qualitative data to make sense of the themes. We read the data associated with each theme to ensure that it had been appropriately interpreted and used this structure to define our themes and understand the story the qualitative data told (Braun & Clarke, 2006). Below is a thematic map demonstrating the relationship and implications of each theme (see Figure 1).
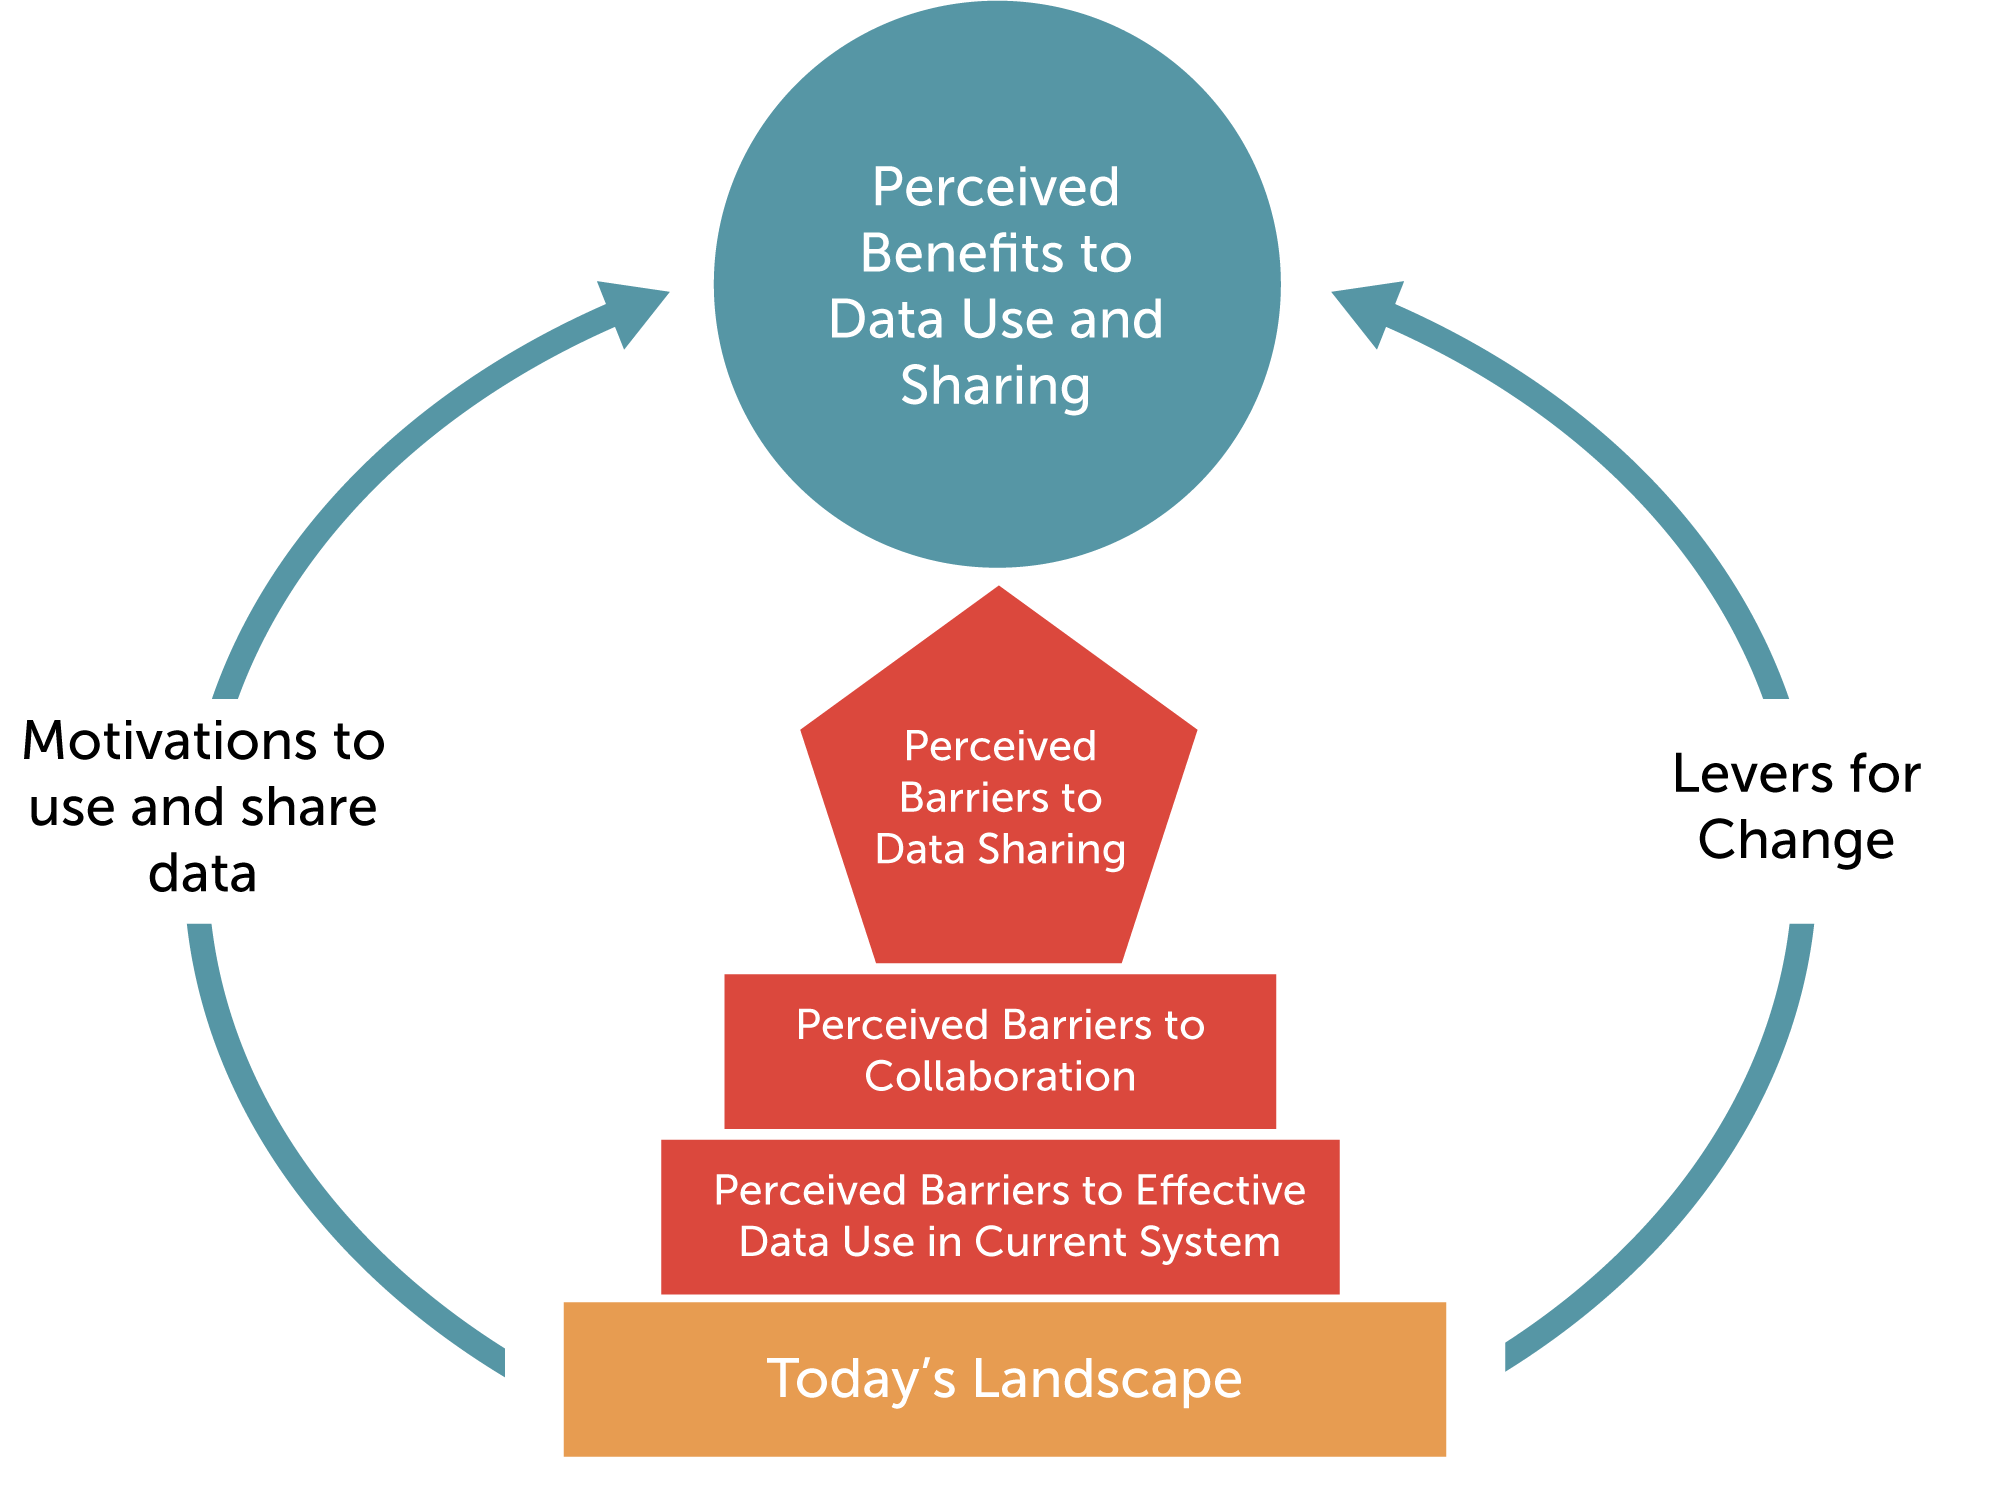 Figure 1. Thematic Map
The research team used this thematic map to develop the report. First, the report describes the need for and benefits of data interoperability in the frontline worker space. It then lays the foundation of today’s landscape and describes the perceived challenges we heard consistently throughout the interviews that make it difficult to achieve data interoperability. The report concludes with recommendations based on the levers of change described most consistently throughout the interviews.